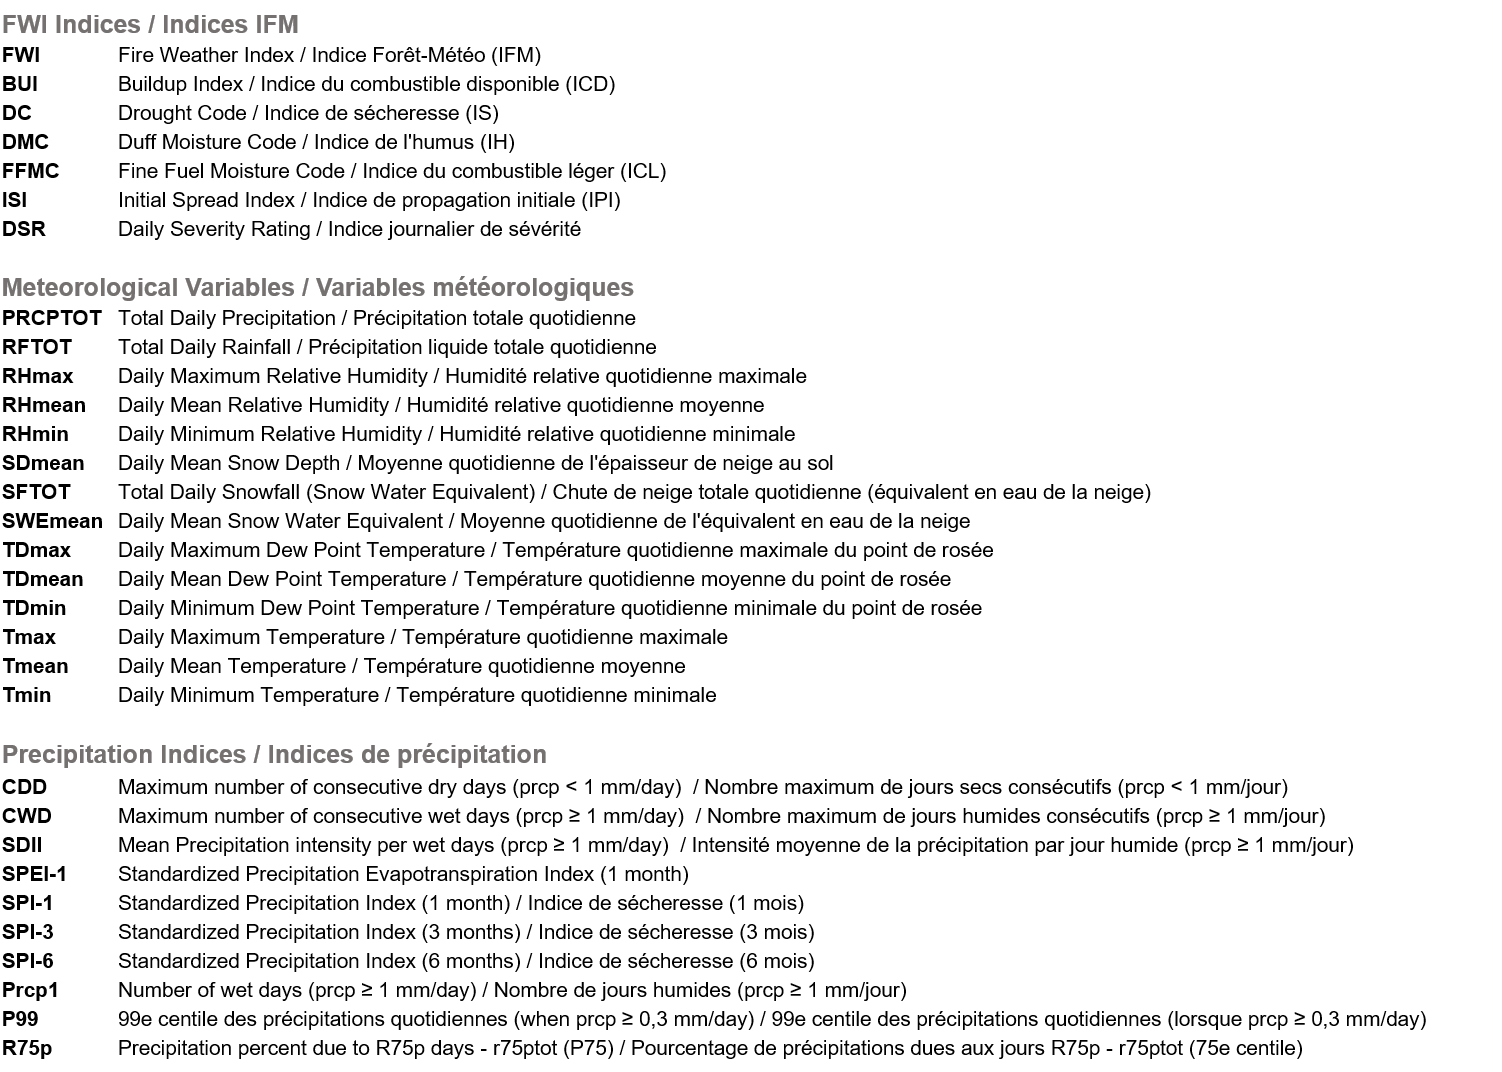
ANALYSIS - Fire weather monitoring (daily data)
This section tracks daily weather and fire danger conditions by predetermined territory and by grid point of approximately 31 km spatial resolution. Interactive meteograms display daily weather fields or FWI indices, plus daily reference values for the period 1991-2020 (minimum, 10th percentile, average, 90th percentile and or maximum) and historical record values (maximum and or minimum) from 1950, without considering the current year. The year associated with each historical record is displayed when the cursor hovers over the data.
In the case of meteograms summarizing conditions at the scale of predetermined territories, the daily reference values for the 30-year period were calculated from the daily fields averaged via a moving average using a three-day period, whereas in the case of meteograms representing conditions at the grid point scale, the climatology of the daily fields was calculated from the daily fields of the corresponding Julian day for each year (without moving average).
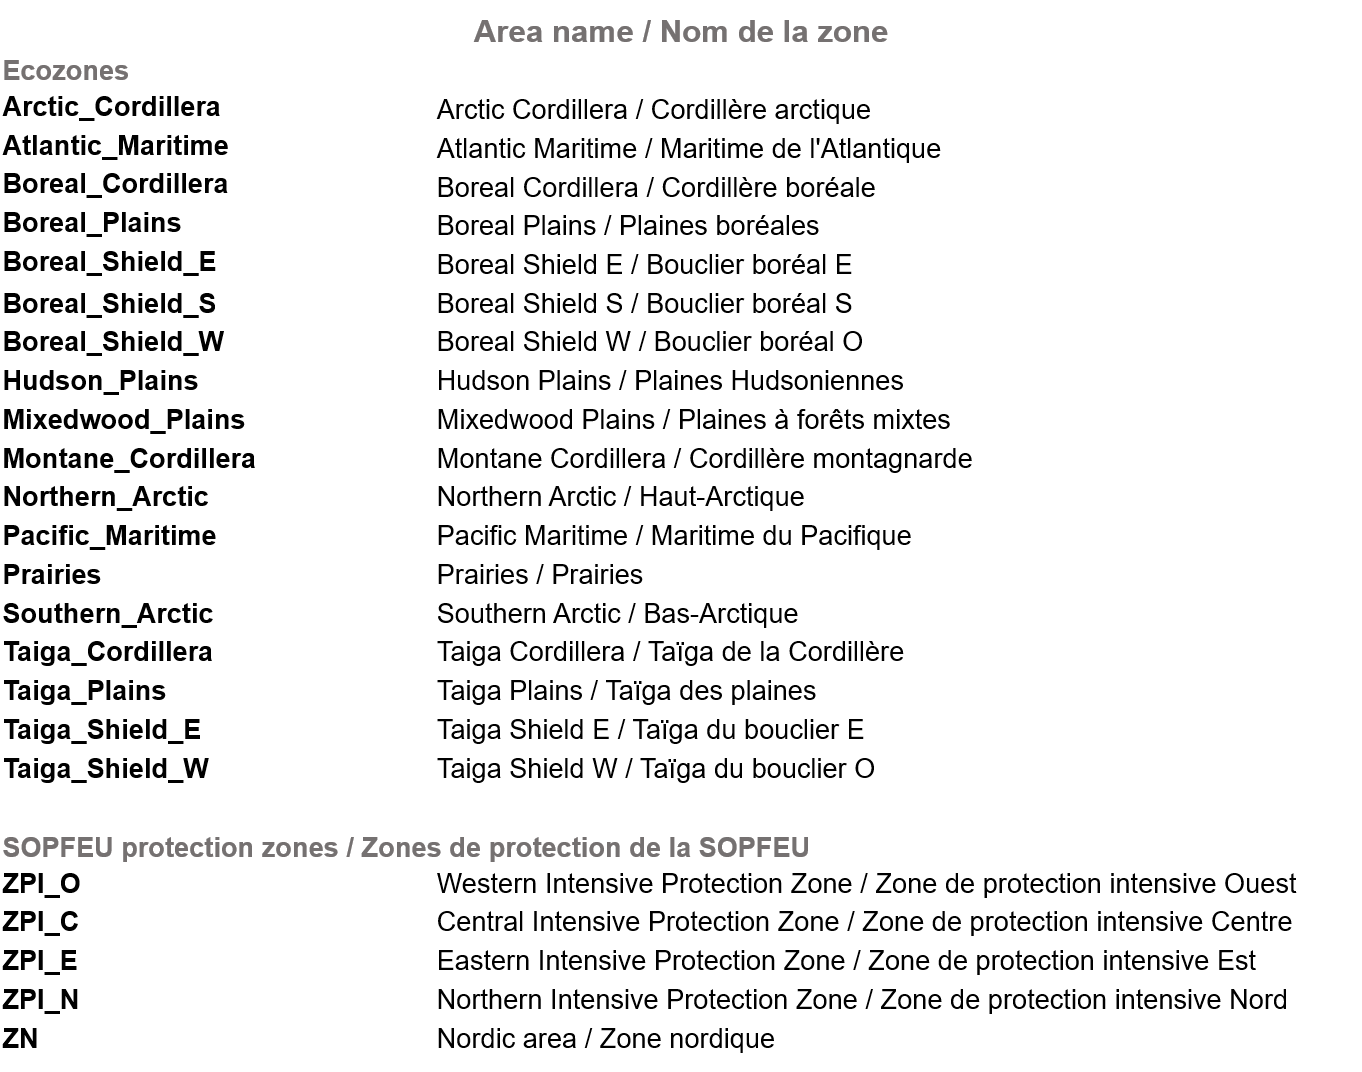
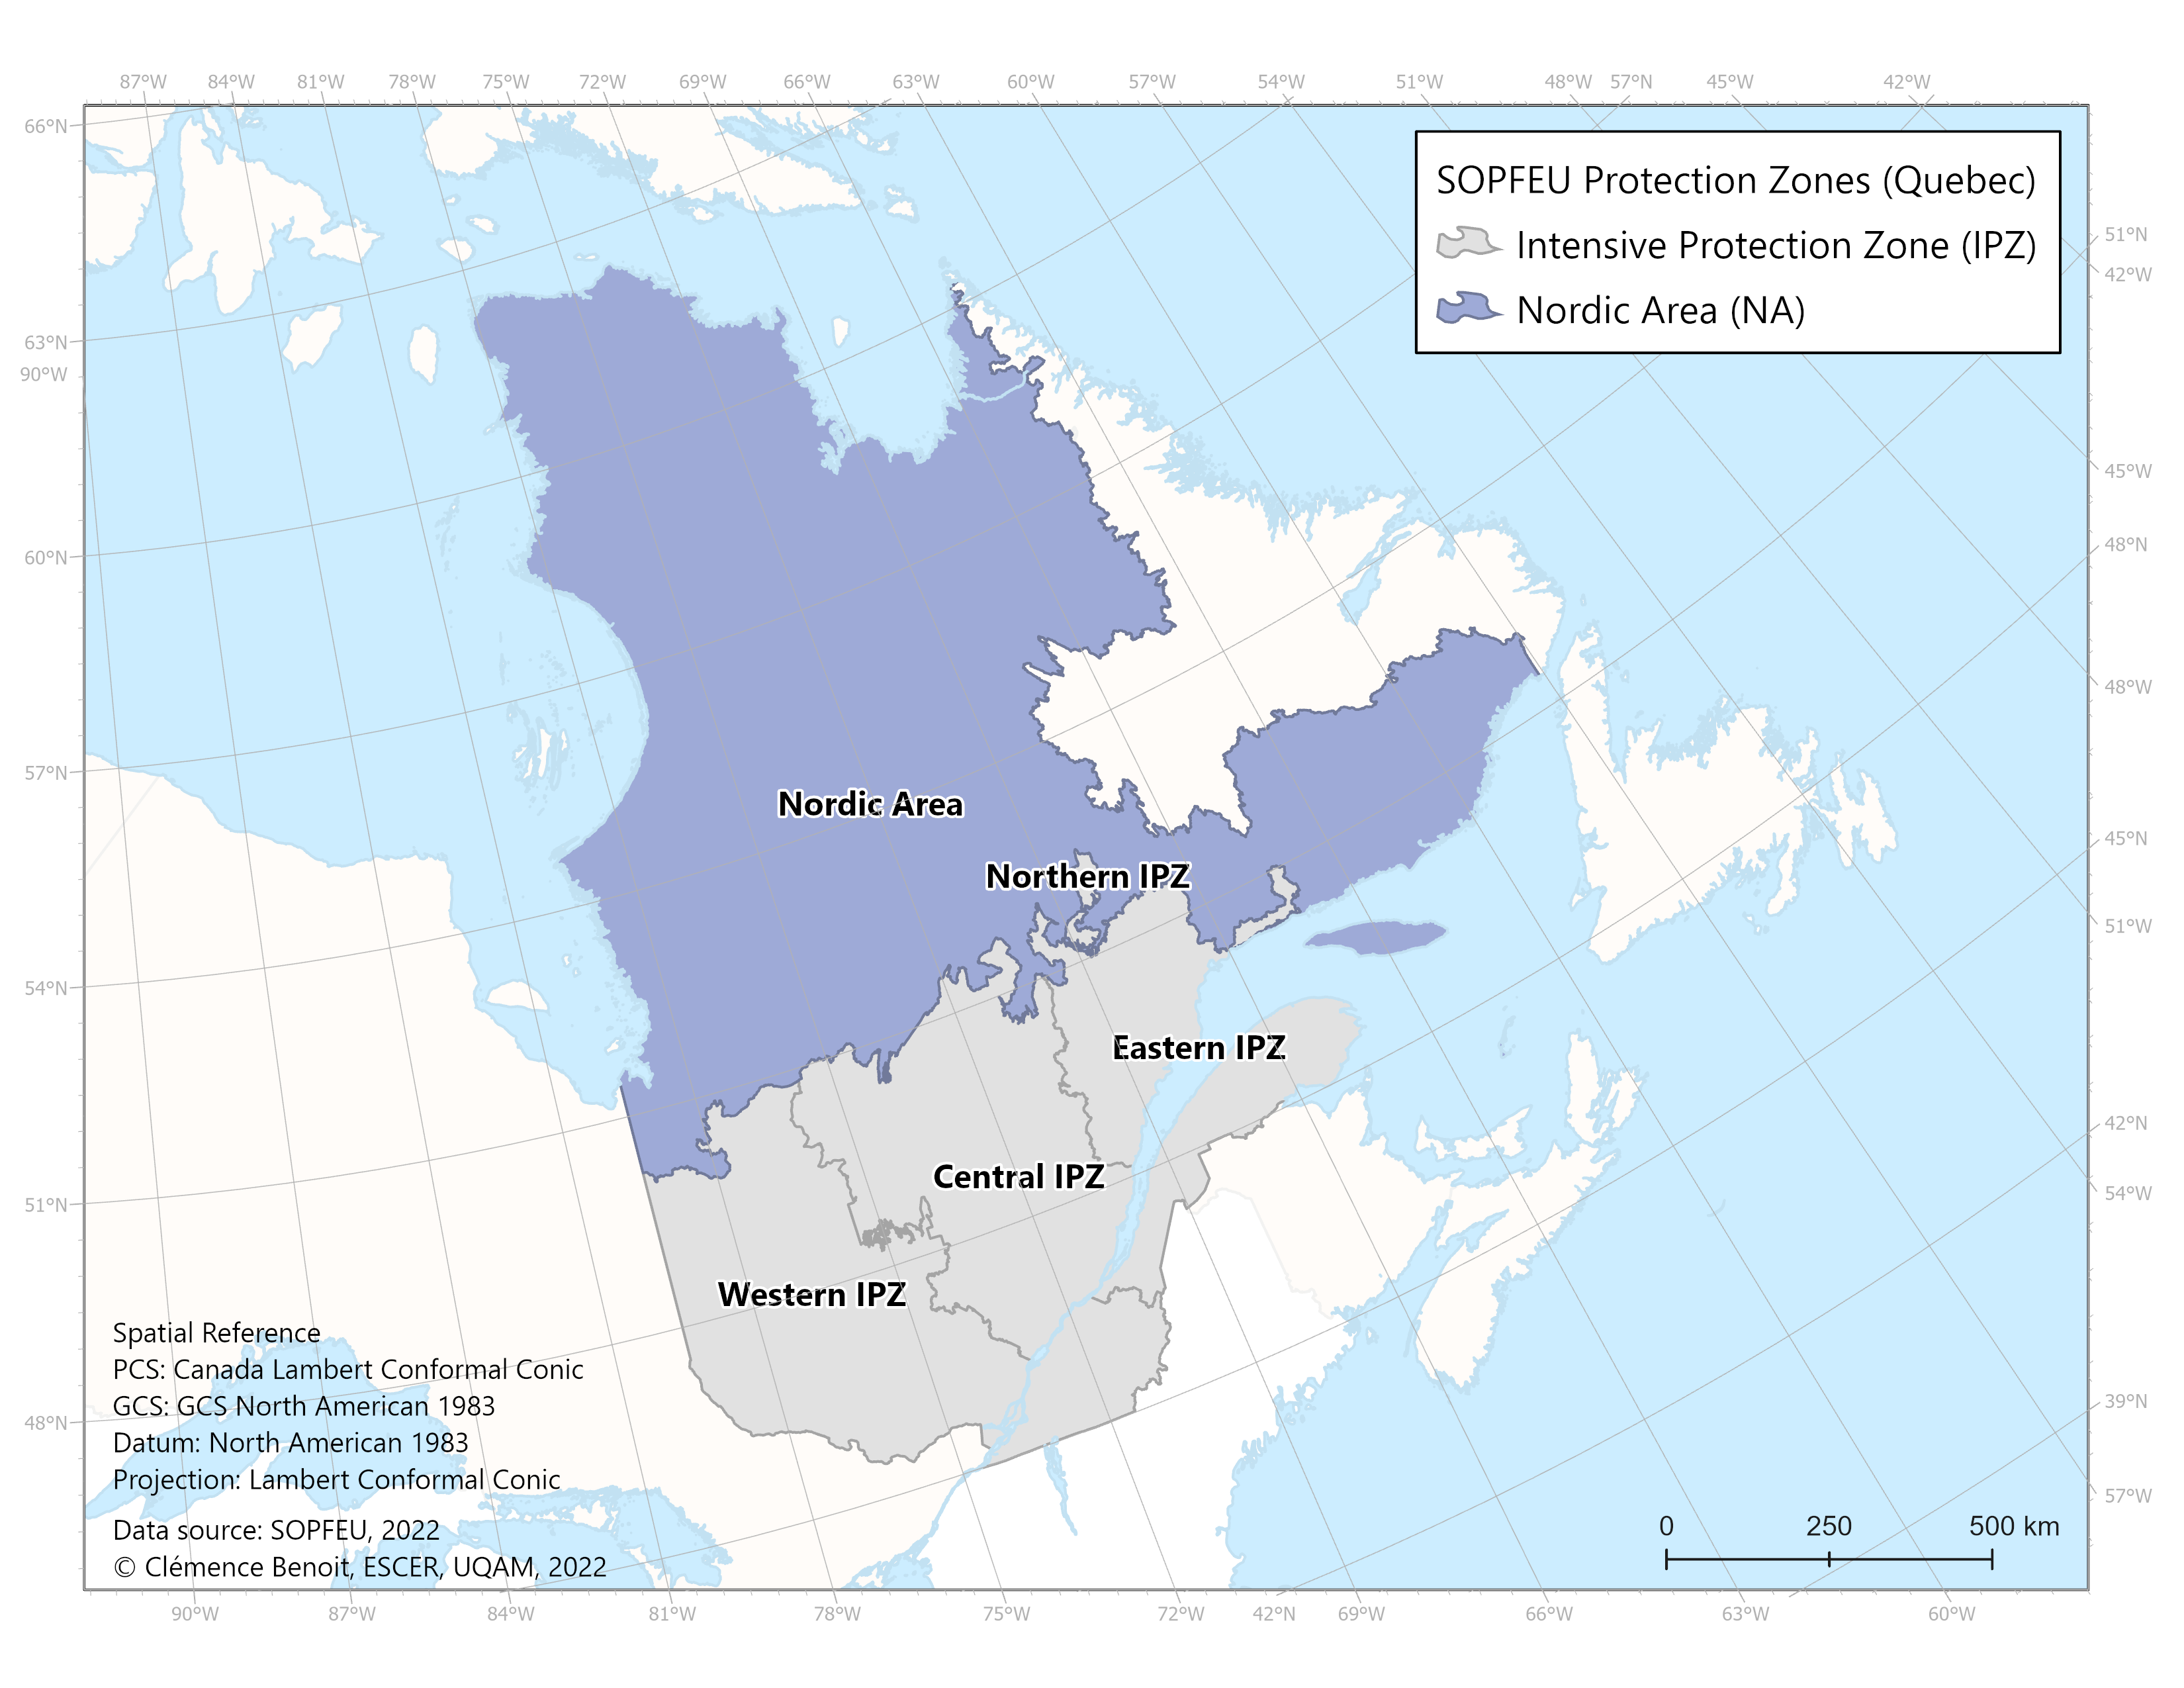
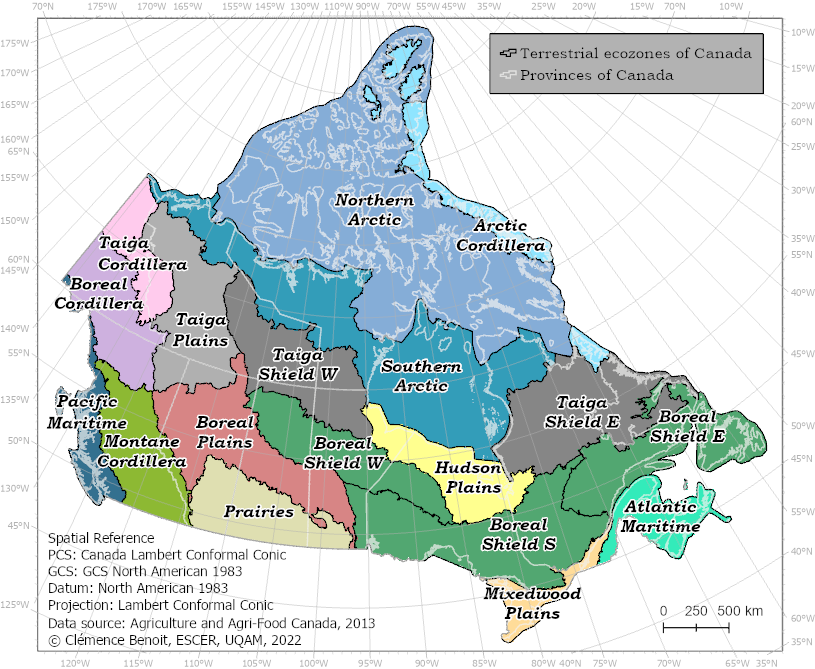
Weather fields and FWI indices were calculated as spatial averages, including in some cases spatial maxima and minima, for the following territories:
The ecozones and the SOPFEU protection zones are defined in the "Spatial scales of analysis" section under the "Methodology" tab.
Using the interactive menu, please select in order, the type of variables (meteorological variables or FWI indices) the year (2021 to present) and the type and name of the sector of interest.