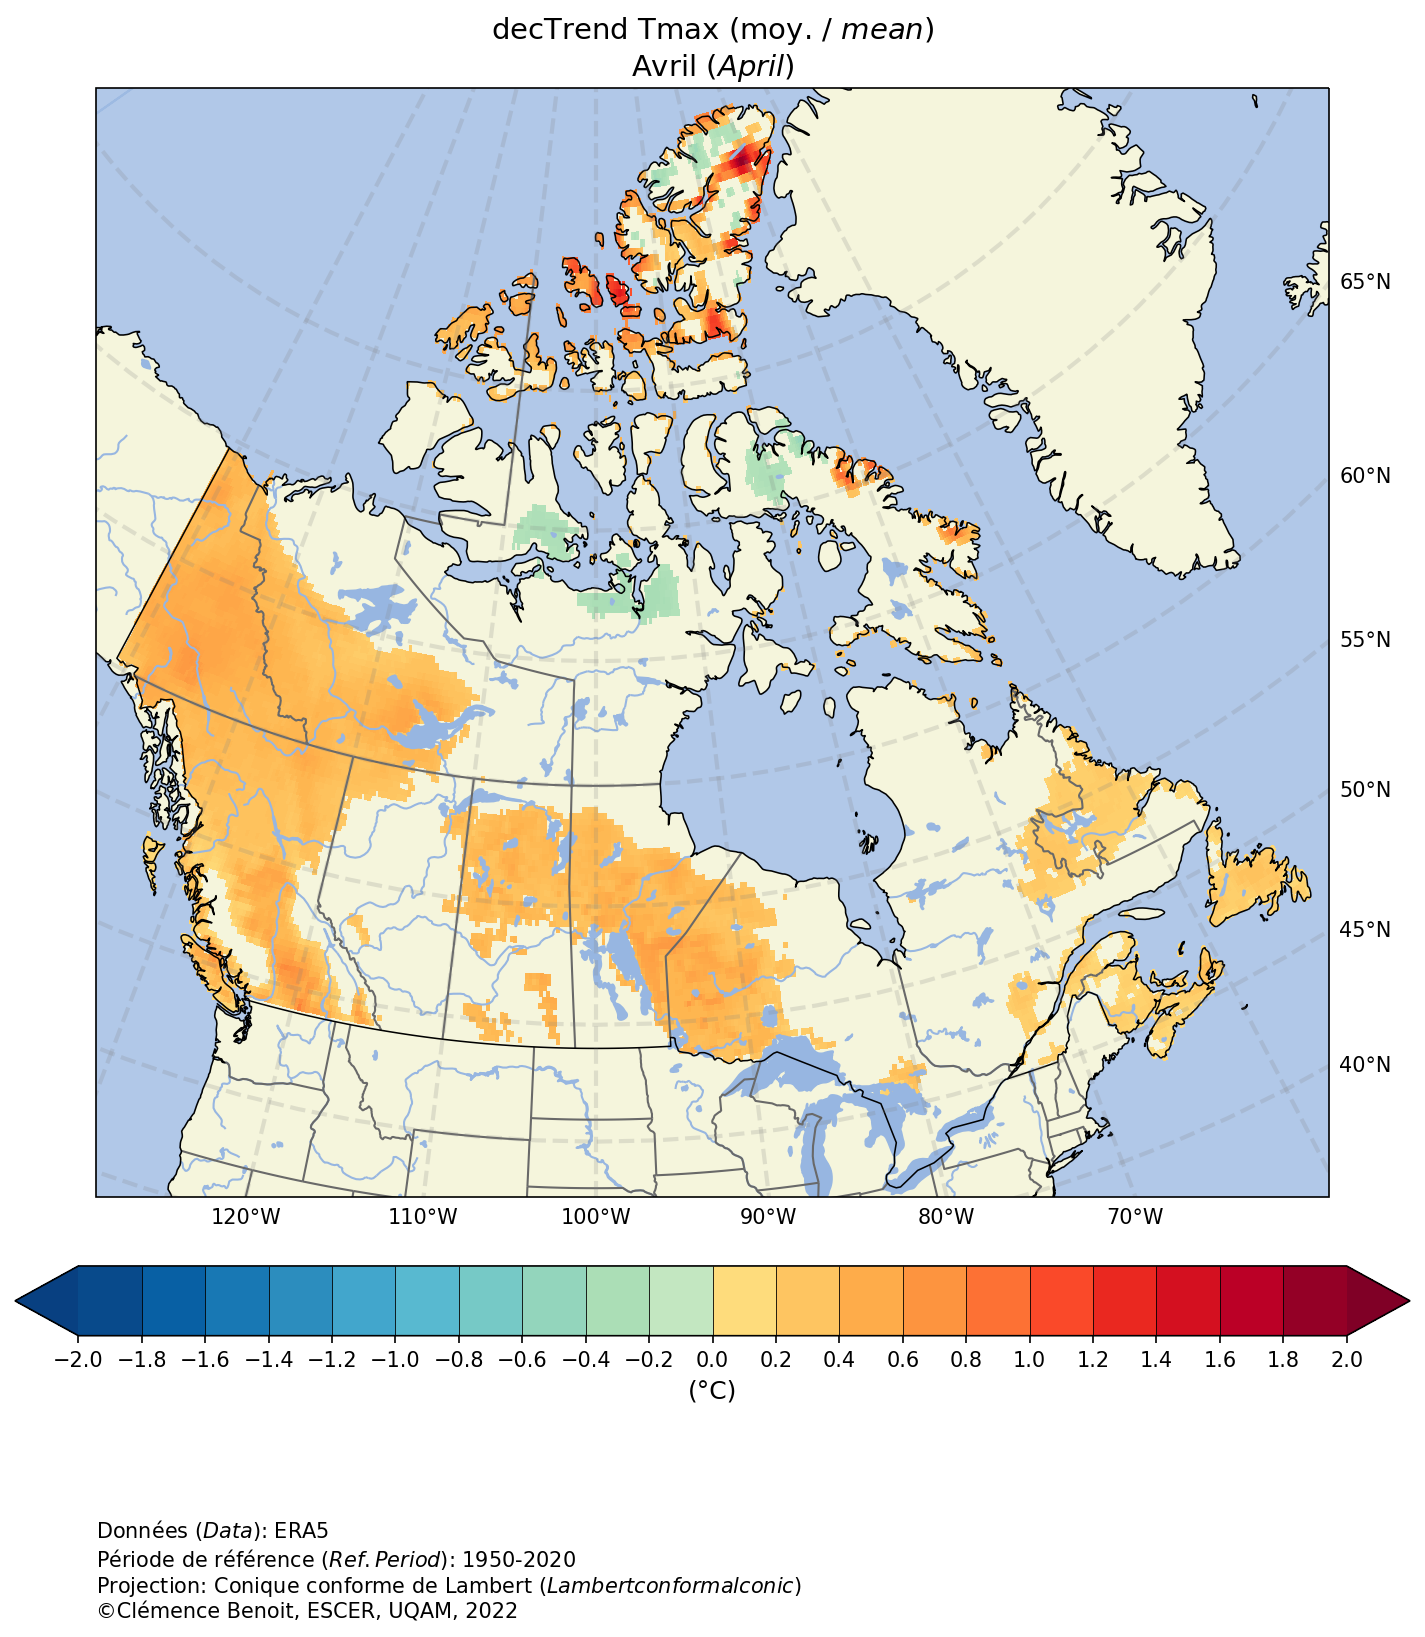
This section provides trends and climate normals maps of the Forest Fire Weather Index (FWI) System components as well as other weather variables and indices for different time periods. All maps are based on ERA5 reanalysis data and have a spatial resolution of approximately 30 km.
Trend values represent the ten-year Theil-Sen slope estimator, which reflects the annual rate of change calculated over a ten-year period. Only the significant trends at a statistical significance level of 10% (p-value ≤ 0.1) are shown. Climate normals refer to the average value of the index or variable over the reference period 1991-2020. This baseline is used, among other purposes, to calculate the anomalies presented in the upper section. More details are provided in the "Methodology" section.
Using the interactive menu, please select, in order: (1) the type of statistical analysis (trend or climate normals), (2) the reference period for calculating trends or normals, (3) the desired variable or index, (4) the time scale for summarizing the variable or index (monthly, seasonal, or annual), (5) the statistic to be calculated on the daily variable or index for the selected period (e.g., monthly average of daily maximum temperature (Tmax)), and (6) the specific month or season, if applicable.
Stat. analysis
Period
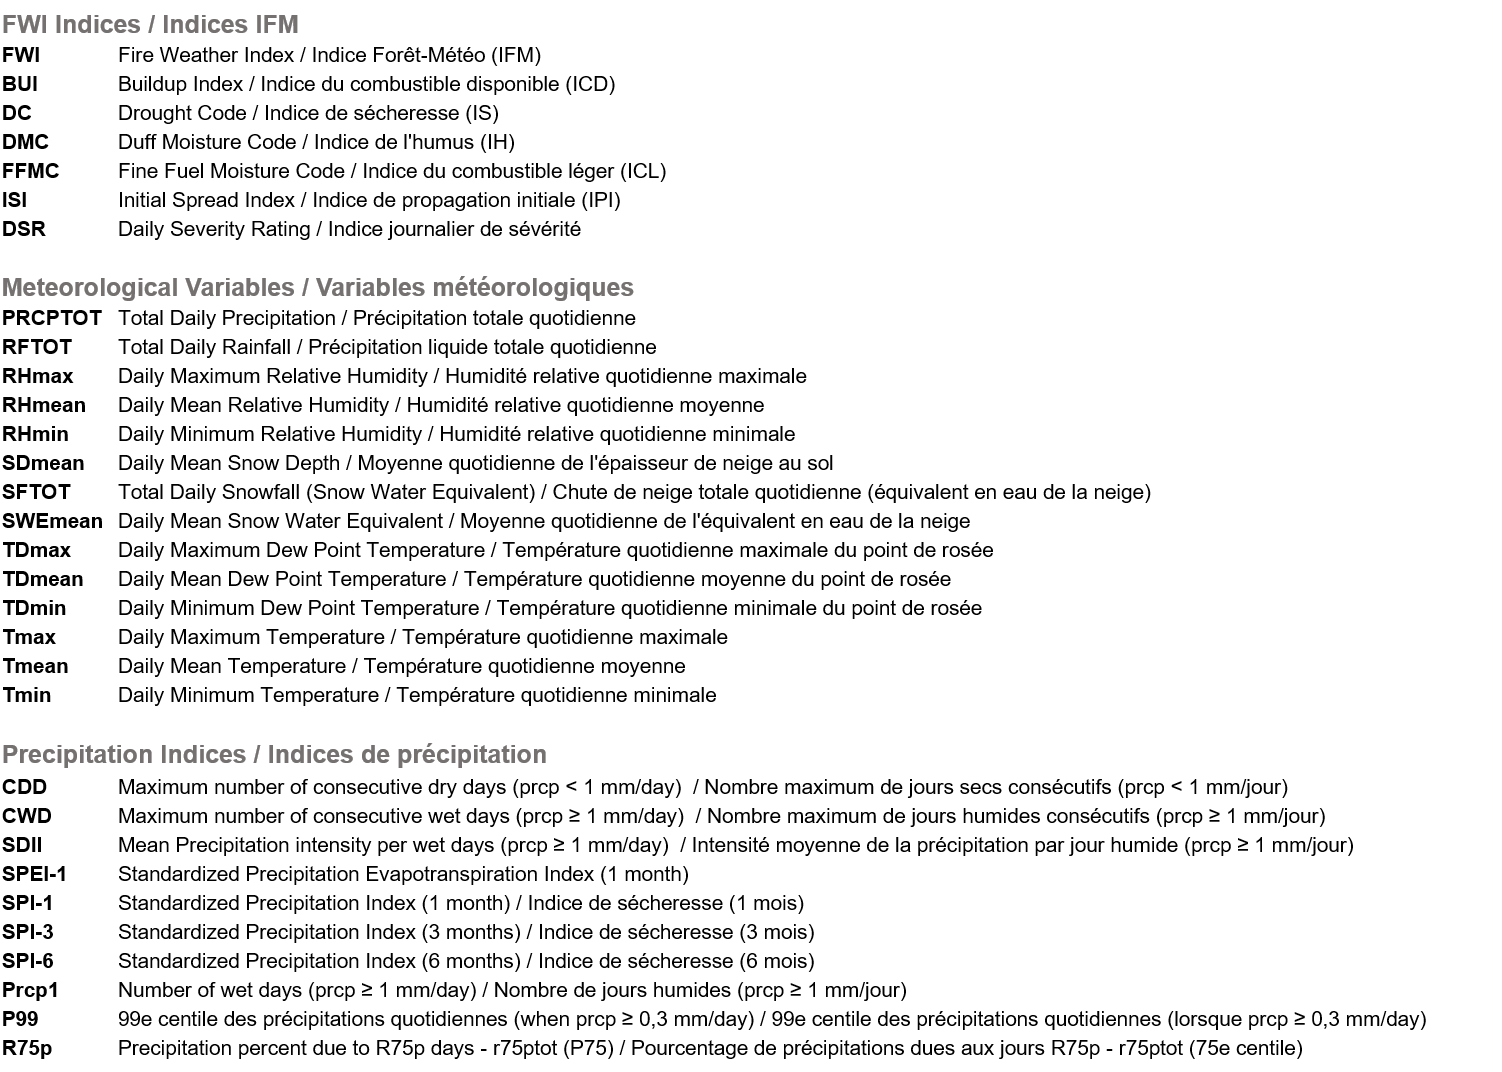
Variable
Time scale
Time scale stat.
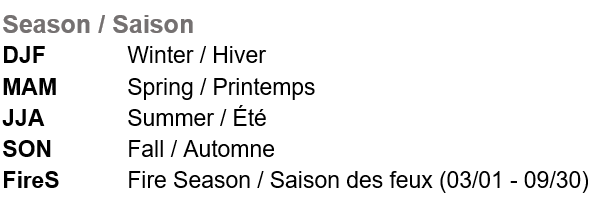
Month / Season