Weather monitoring
In this section, various products are generated to track daily, monthly, seasonal and annual weather variables and FWI indices across Canada, calculated from hourly variables from the ERA5 reanalysis. The products are derived from analyses that were first conducted for each grid point of approximately 31 km resolution (native ERA5 resolution) covering all of Canada's land surfaces.
Weather fields and anomalies
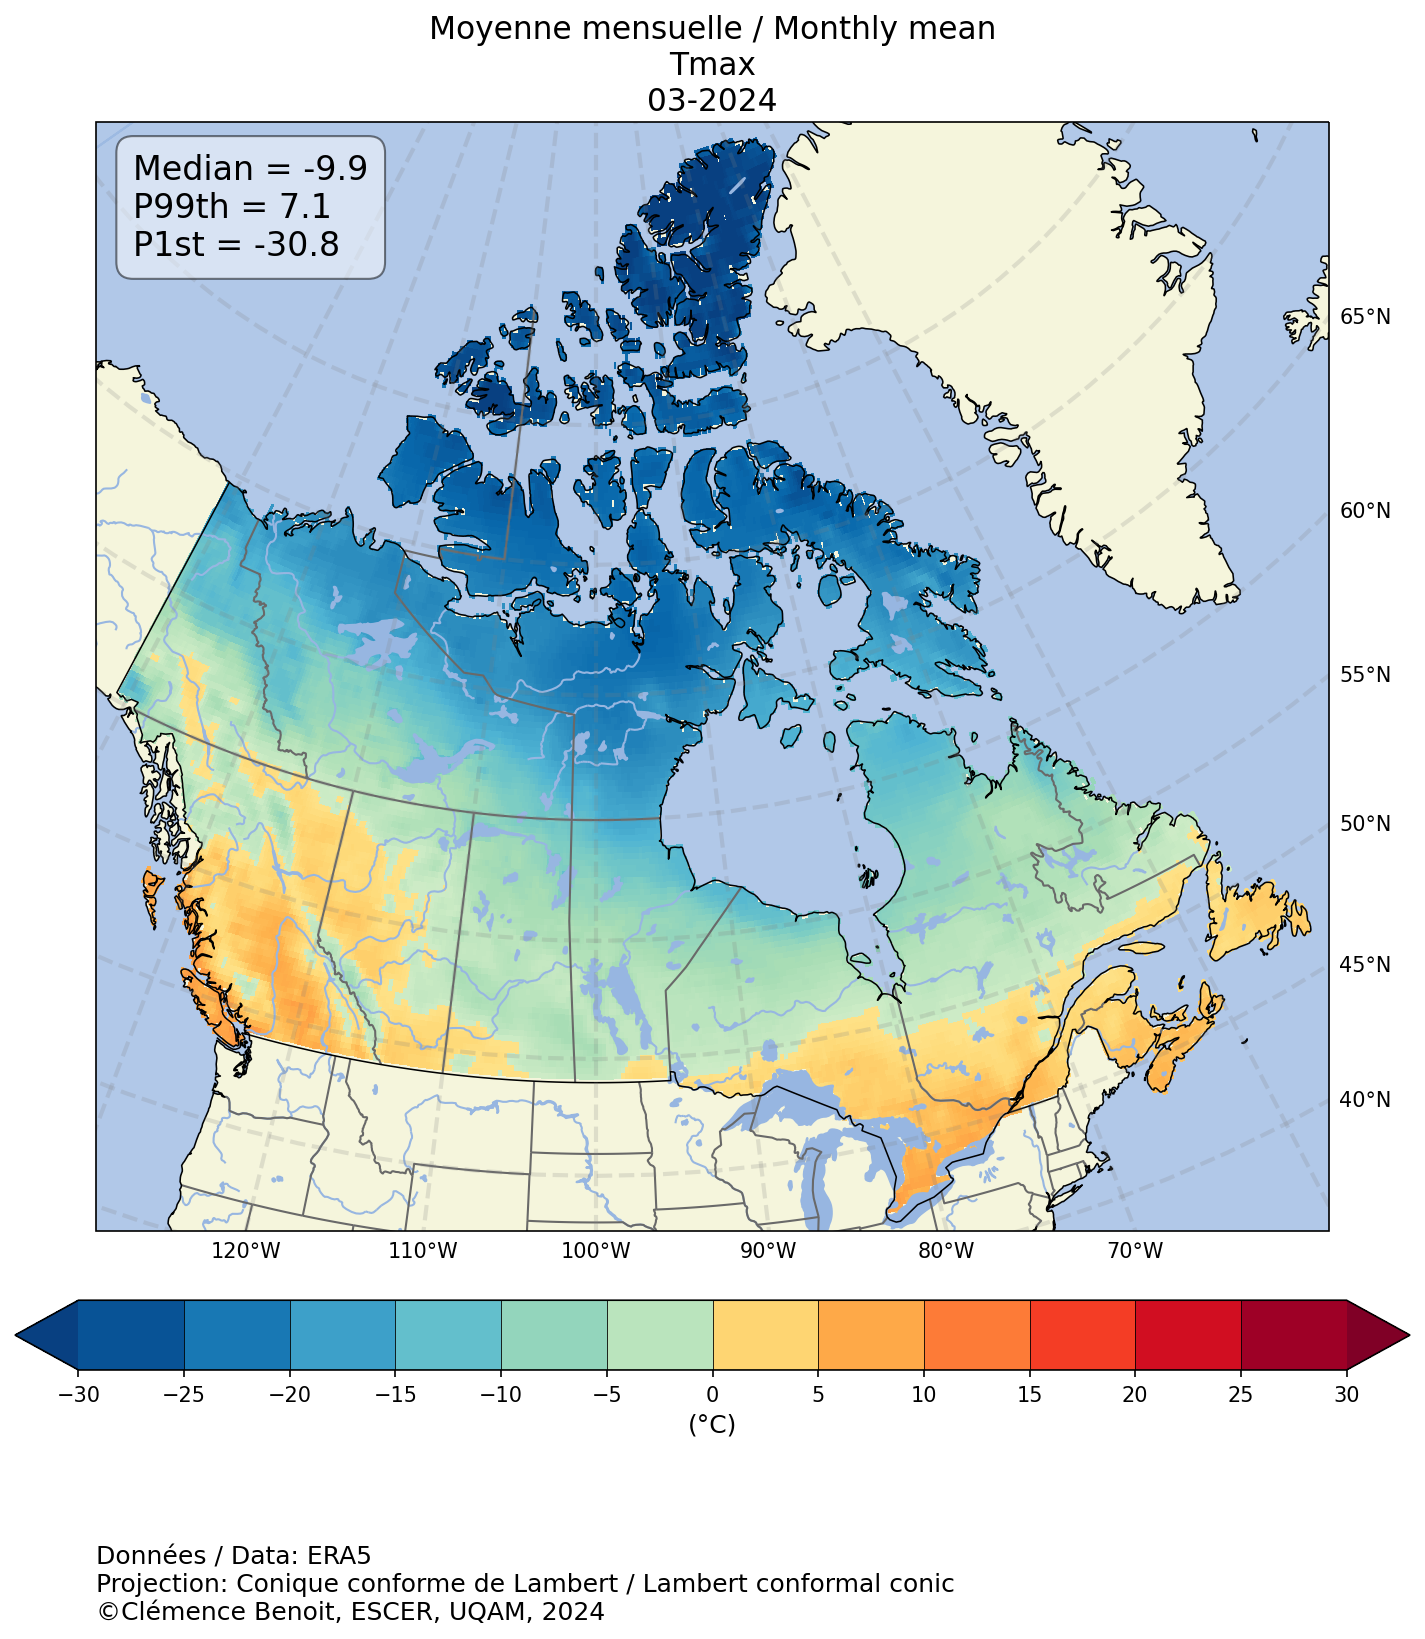
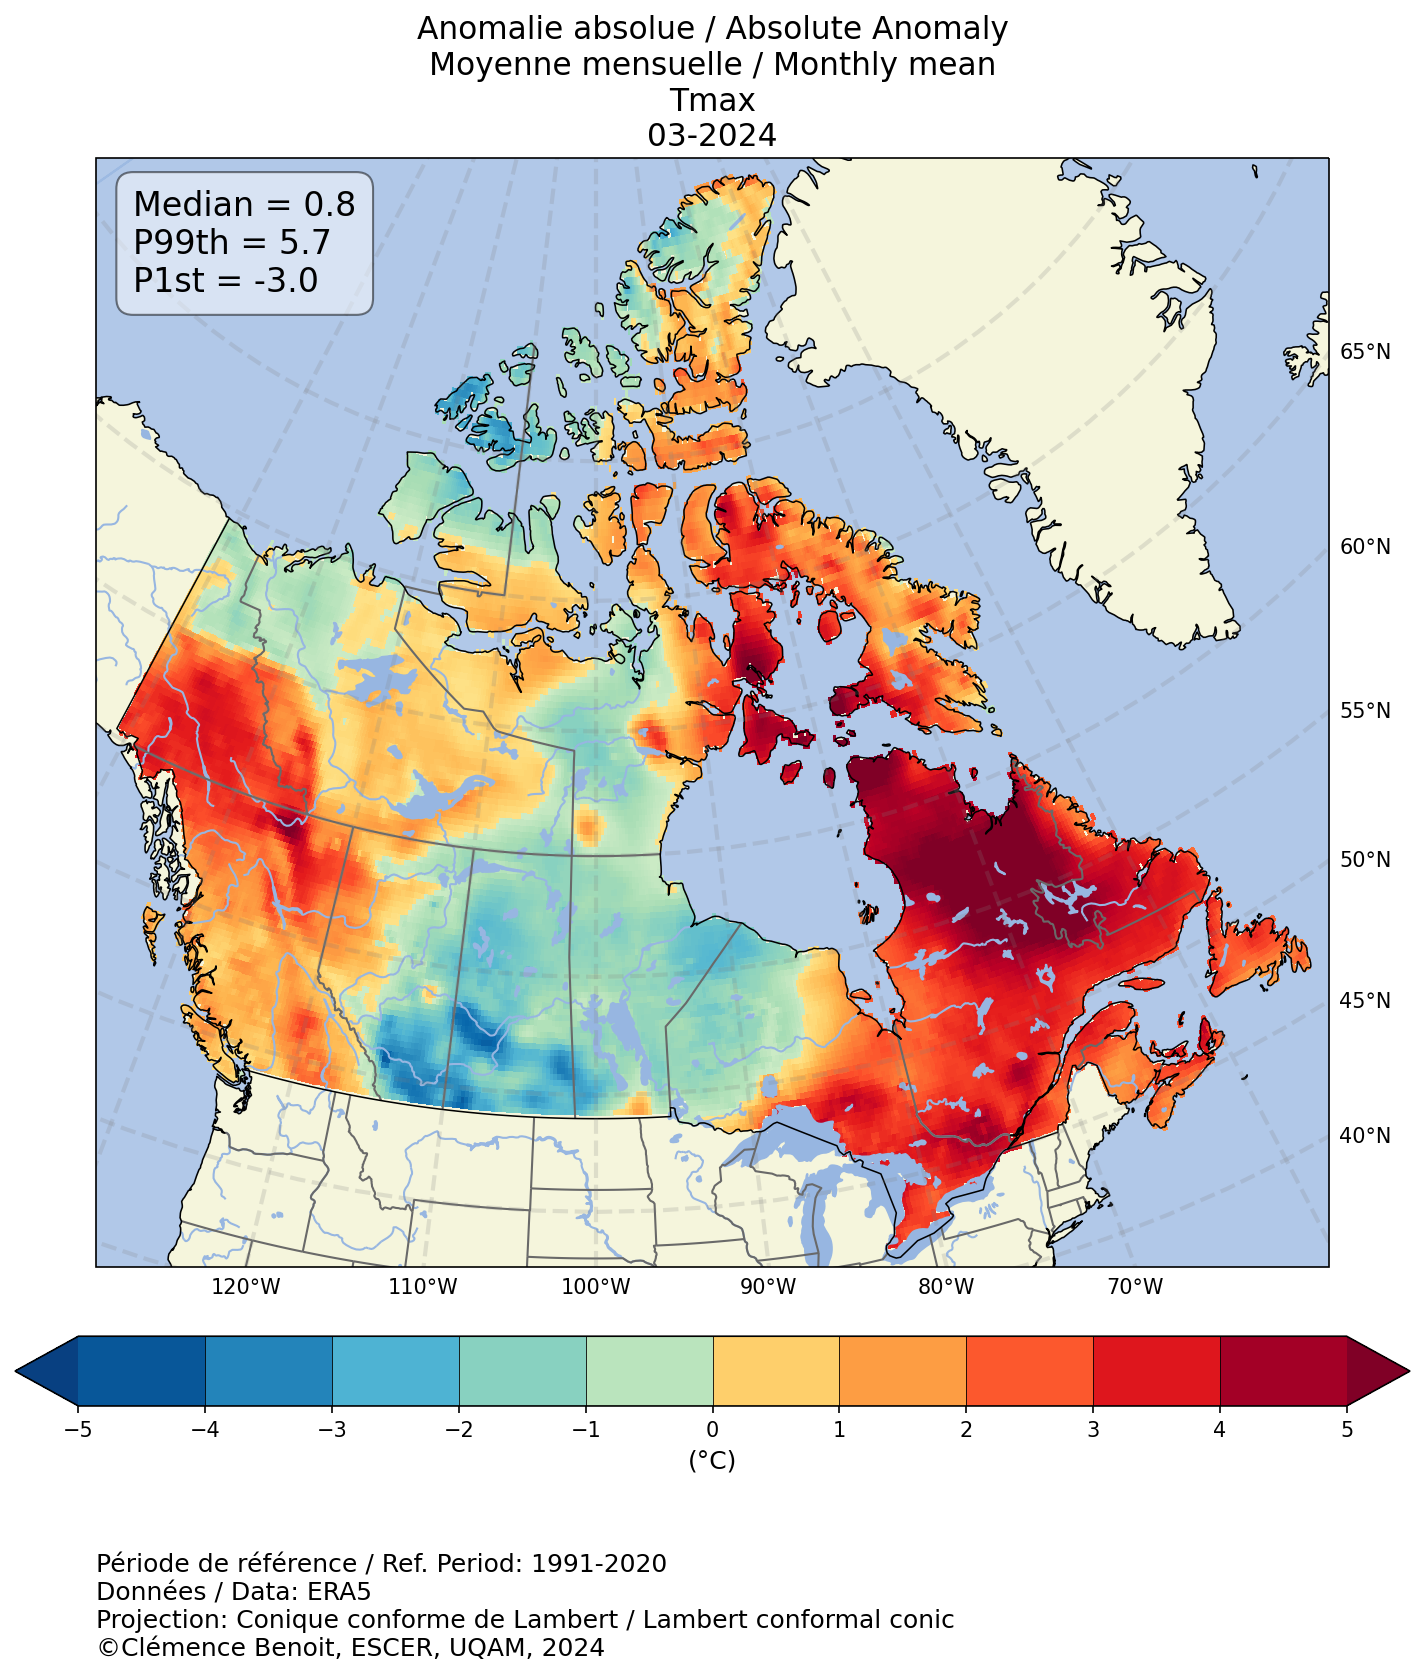
This section provides maps of monthly, seasonal, or annual meteorological fields or indices (left panel) and anomaly (absolute, relative or standardized by standard deviation) values of these fields or indices relative to normal values (reference period 1991 to 2020; right panel). The maps are produced at a spatial resolution of approximately 31 km and their extent covers all of Canada's land mass.
A positive anomaly indicates a value higher than the normal value, while a negative anomaly indicates a value below the normal value. The absolute anomaly provides the deviation from the normal value in number of units, the unit corresponding to that of the variable or index in question. The relative anomaly provides the relative deviation from the normal value as a percentage (%). The standardised anomaly is the deviation from the normal value where the deviation is standardised by the standard deviation of the climatology or reference period. It allows to compare anomalies between variables or indices, without regard to the variability specific to each variable and therefore has no units as such. Further details are provided in the "Methodology" section.
Using the interactive menu, please select, in order, the daily variable or index, the time scale to which the variable or index is summarized (monthly, seasonal or annual), the statistic calculated on the daily variable or index for the selected period (e.g. monthly maximum or minimum), the year (from 2015 to today) and the month or season, where applicable. The last button allows you to select the type of anomaly shown in the right-hand panel.
Variable / Index
Frequency
Statistic Freq.
Year
Month / Season
Anomaly
Interactive Meteograms
The second section tracks daily weather and fire danger conditions by predetermined territory and by grid point of approximately 31 km spatial resolution. Interactive meteograms display daily weather fields or FWI indices, plus daily reference values for the period 1991-2020 (minimum, 10th percentile, average, 90th percentile and or maximum) and historical record values (maximum and or minimum) from 1950, without considering the current year. The year associated with each historical record is displayed when the cursor hovers over the data.
In the case of meteograms summarizing conditions at the scale of predetermined territories, the daily reference values for the 30-year period were calculated from the daily fields averaged via a moving average using a three-day period, whereas in the case of meteograms representing conditions at the grid point scale, the climatology of the daily fields was calculated from the daily fields of the corresponding Julian day for each year (without moving average).
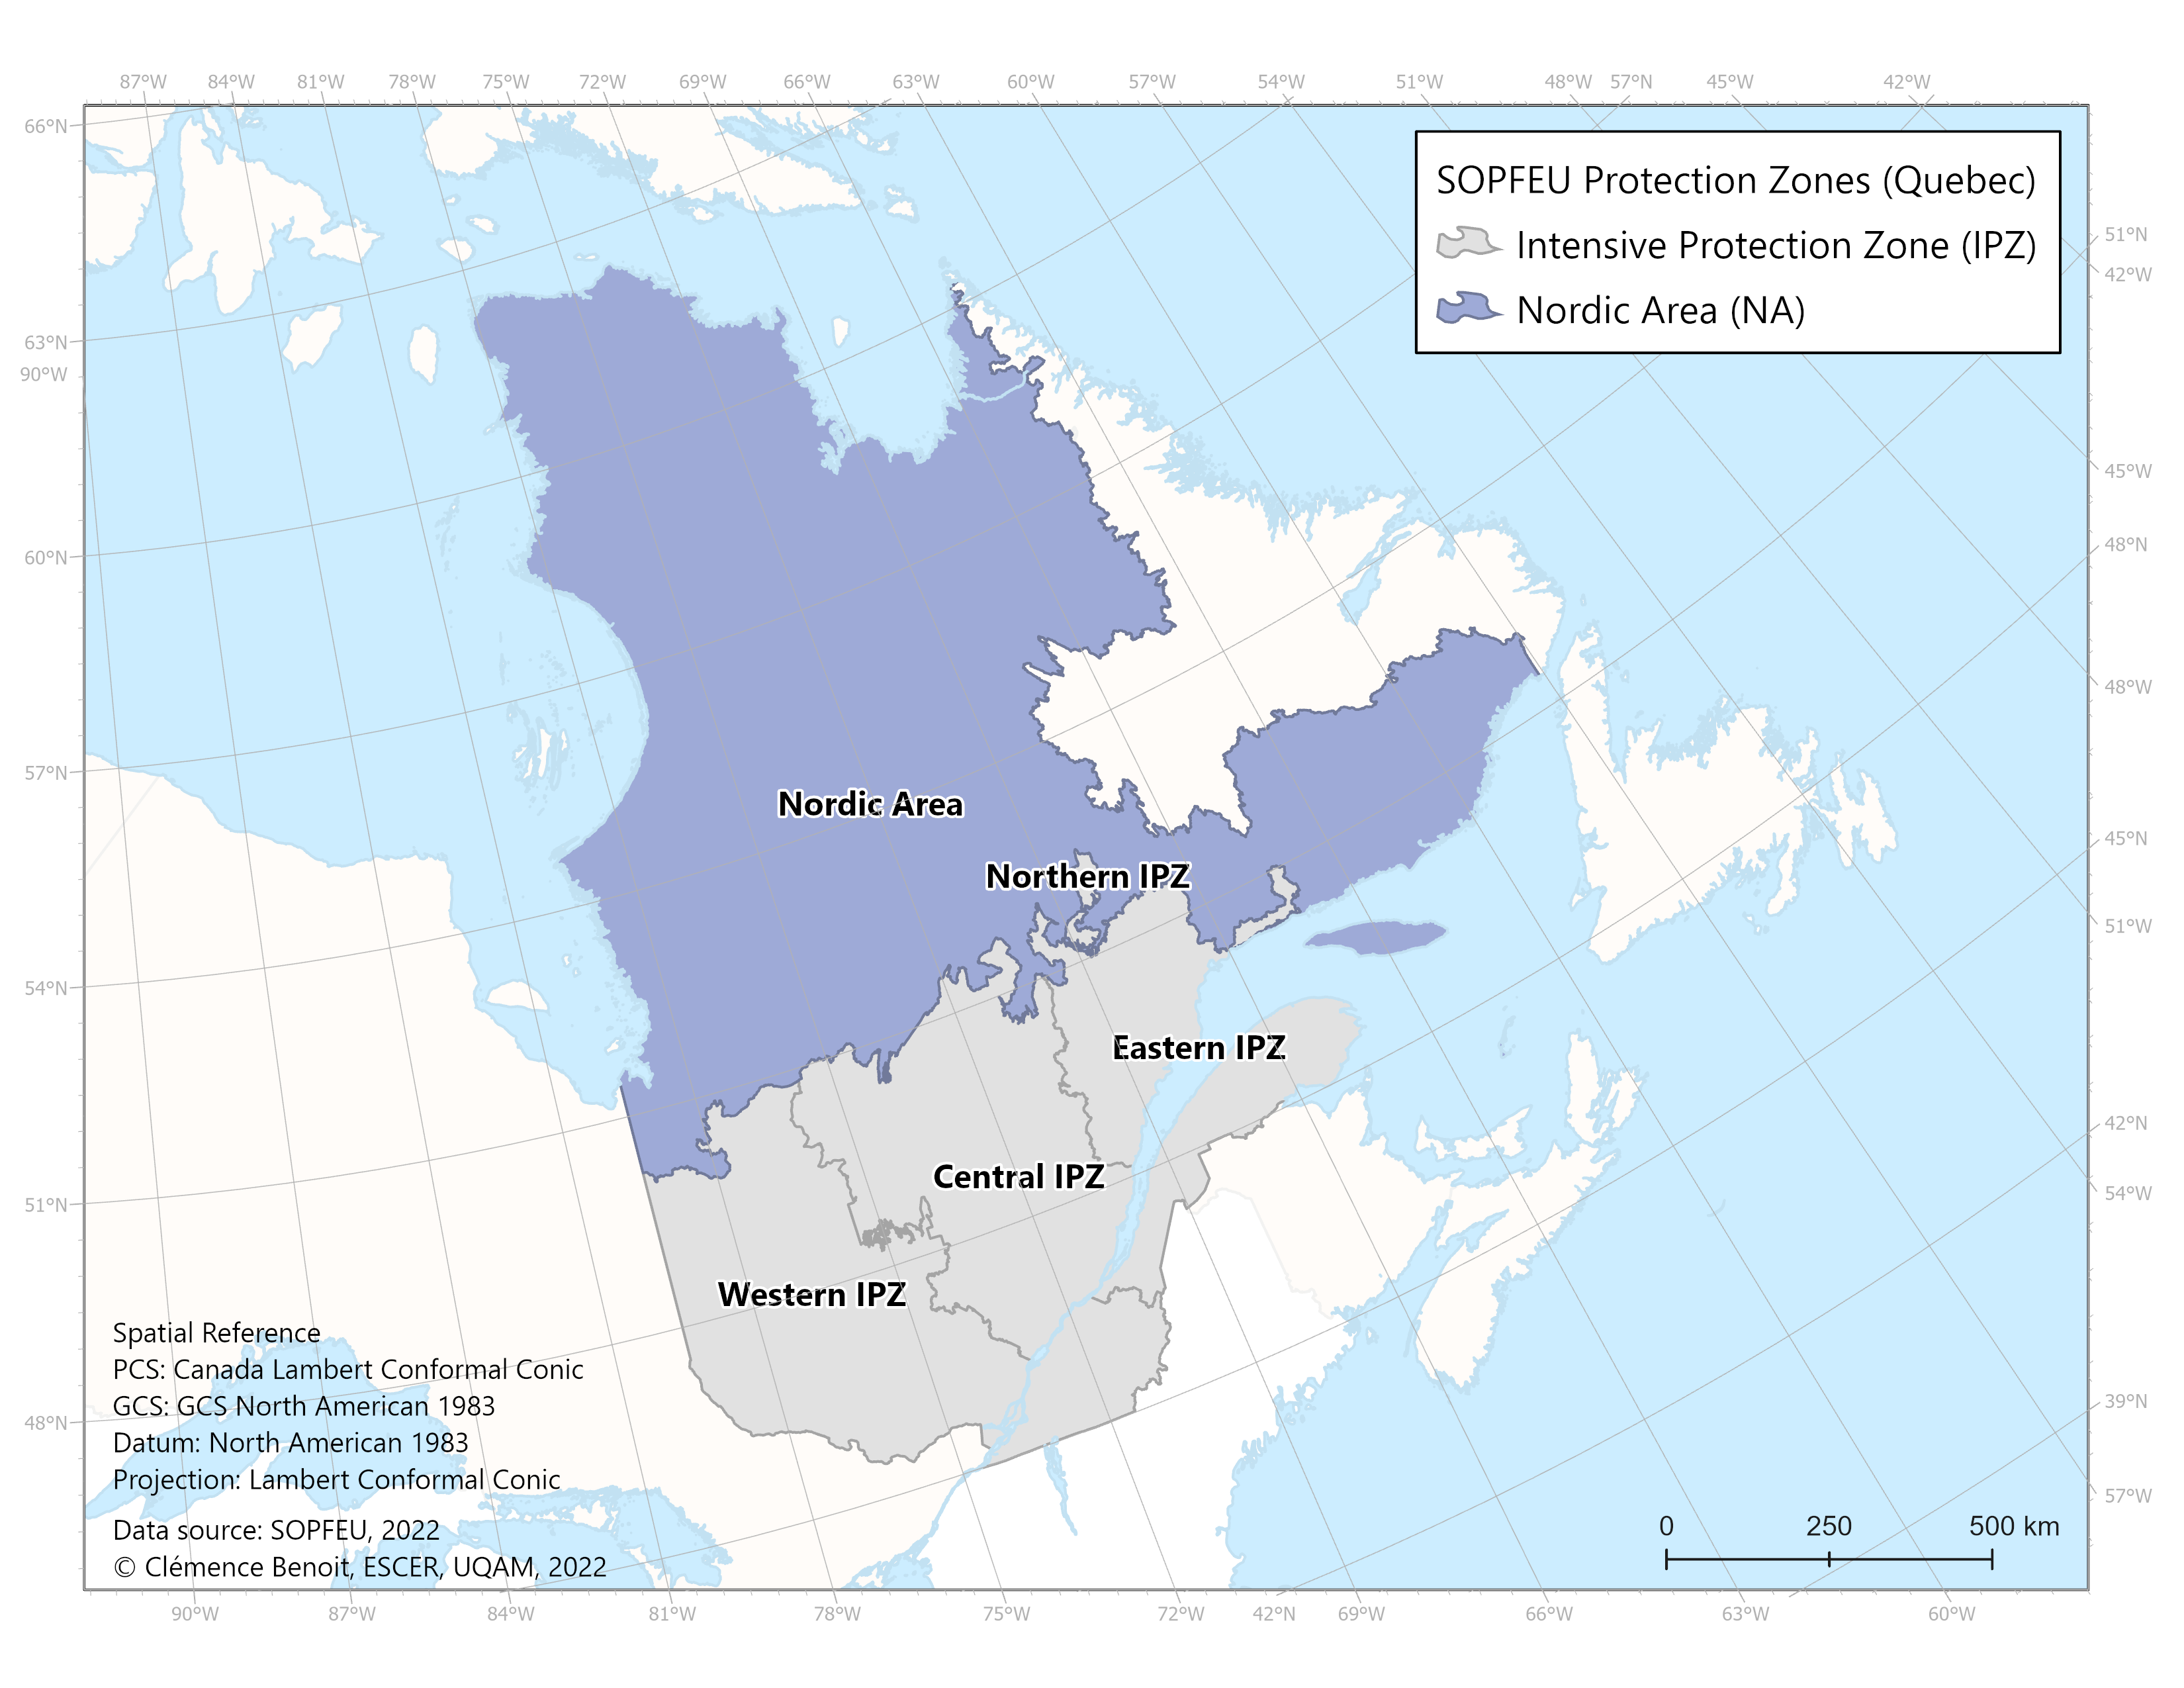
Monitoring weather conditions by territory
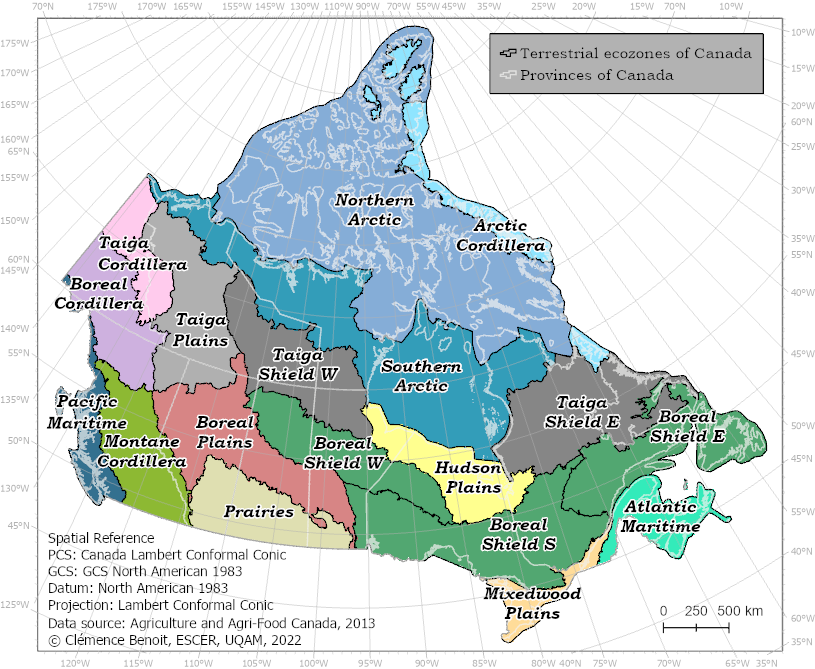
Weather fields and FWI indices were calculated as spatial averages, including in some cases spatial maxima and minima, for the following territories:
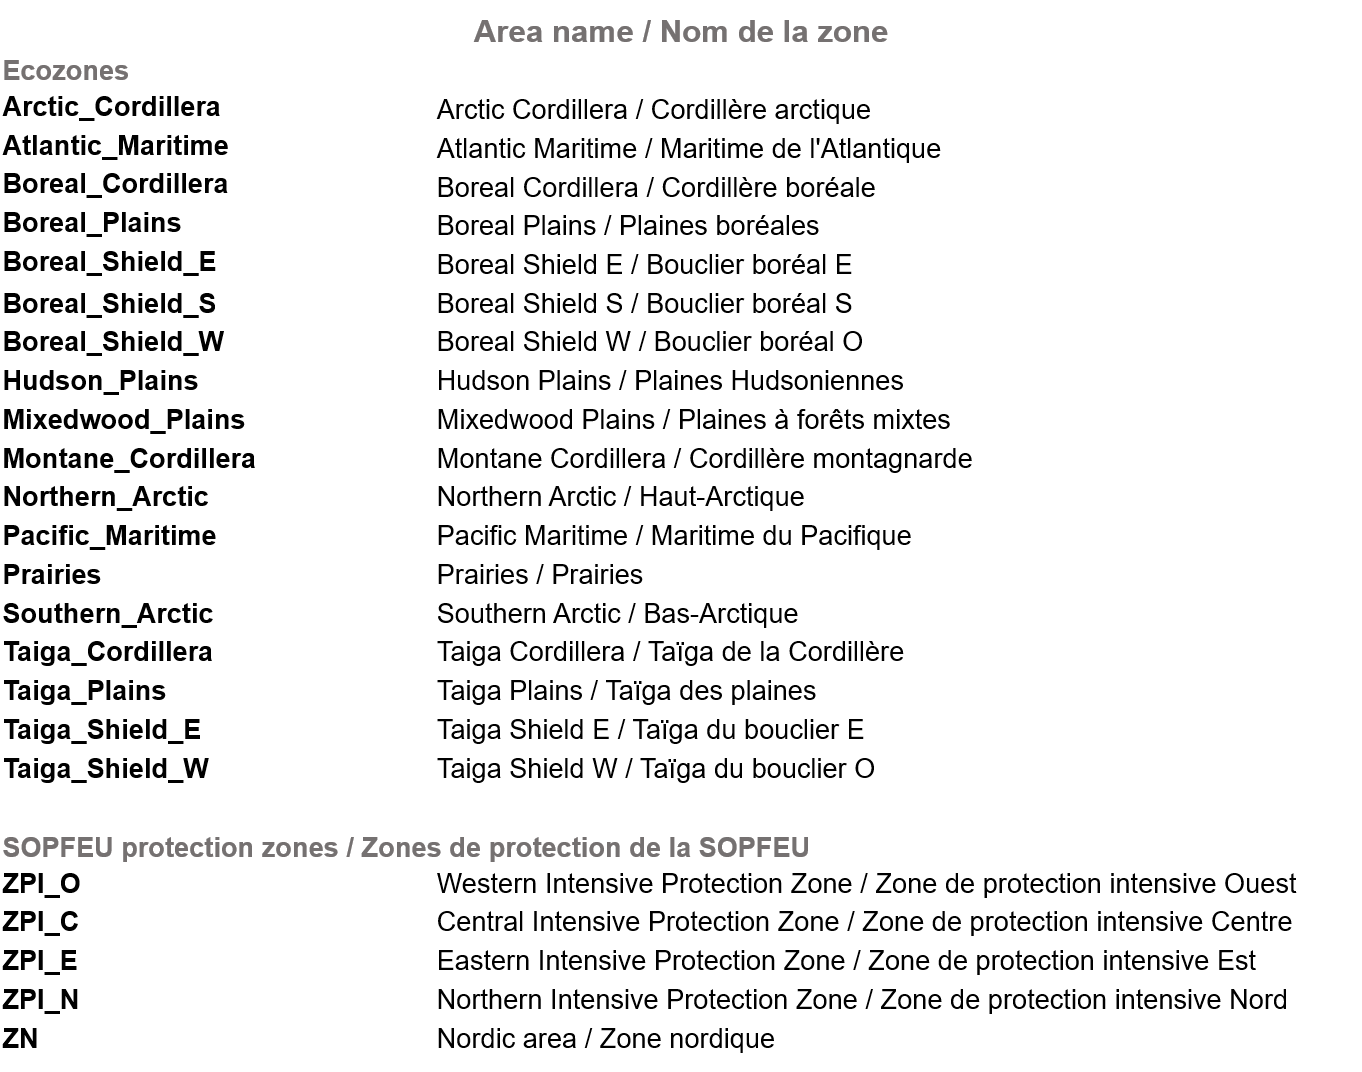
The ecozones and the SOPFEU protection zones are defined in the "Spatial scales of analysis" section under the "Methodology" tab.
Using the interactive menu, please select in order, the type of variables (meteorological variables or FWI indices), the year (2021 to present) and the type and name of the sector of interest.
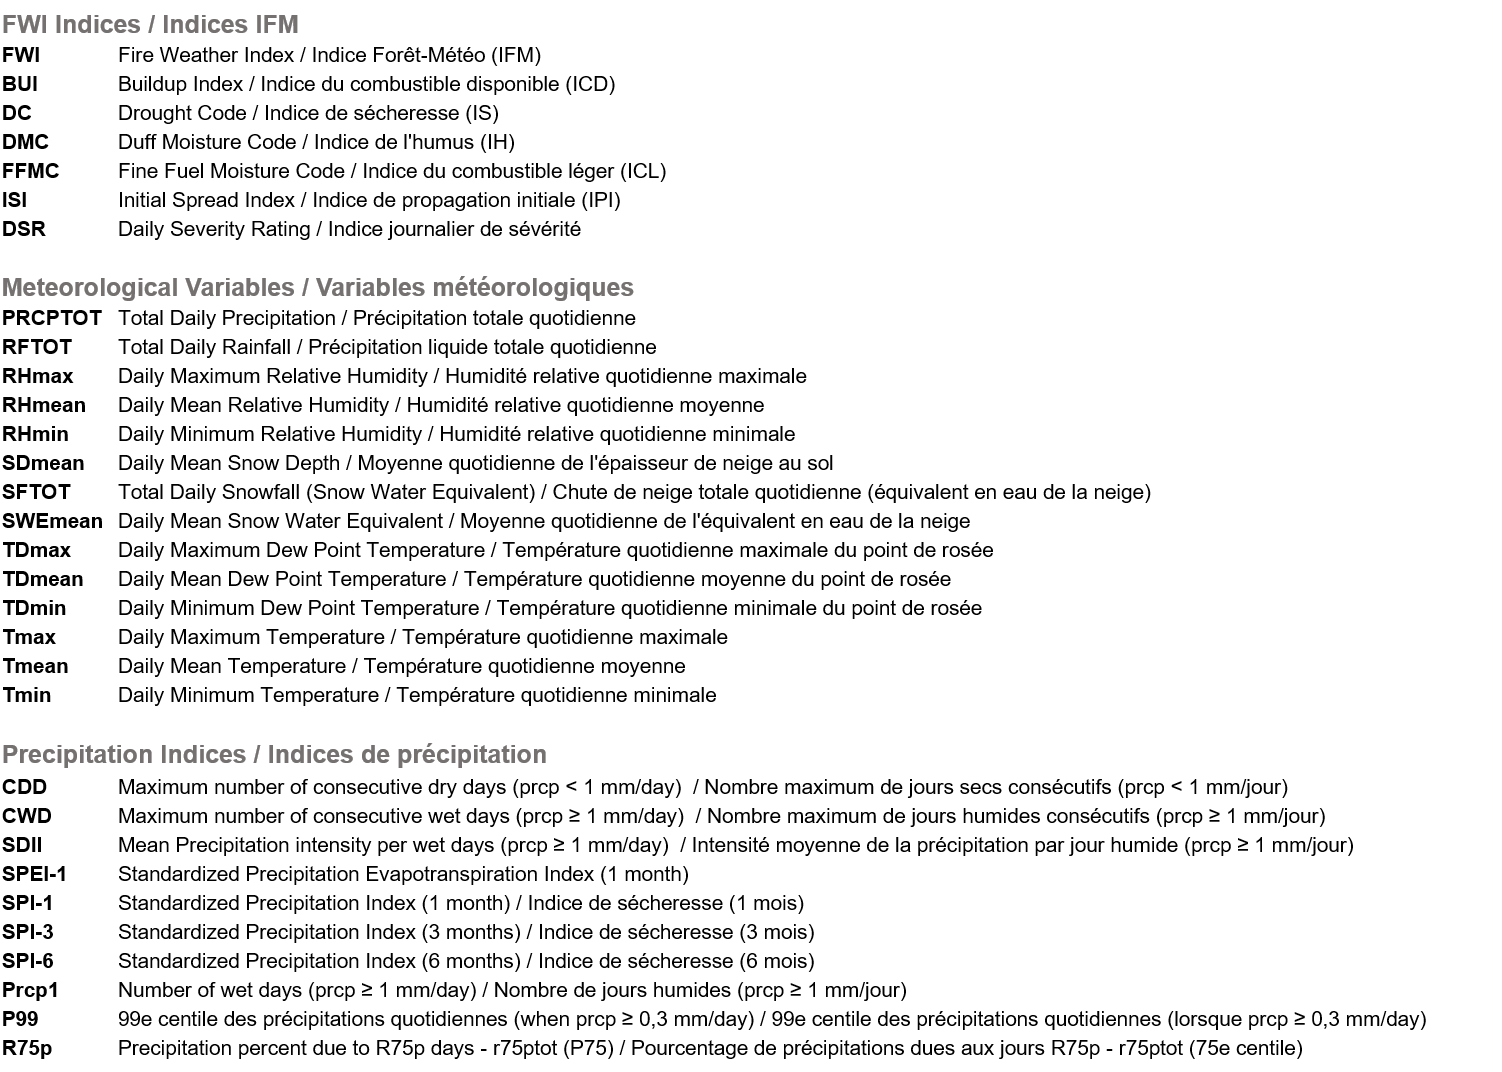
Definition of variables & indices
Definition of seasons

Definition of areas
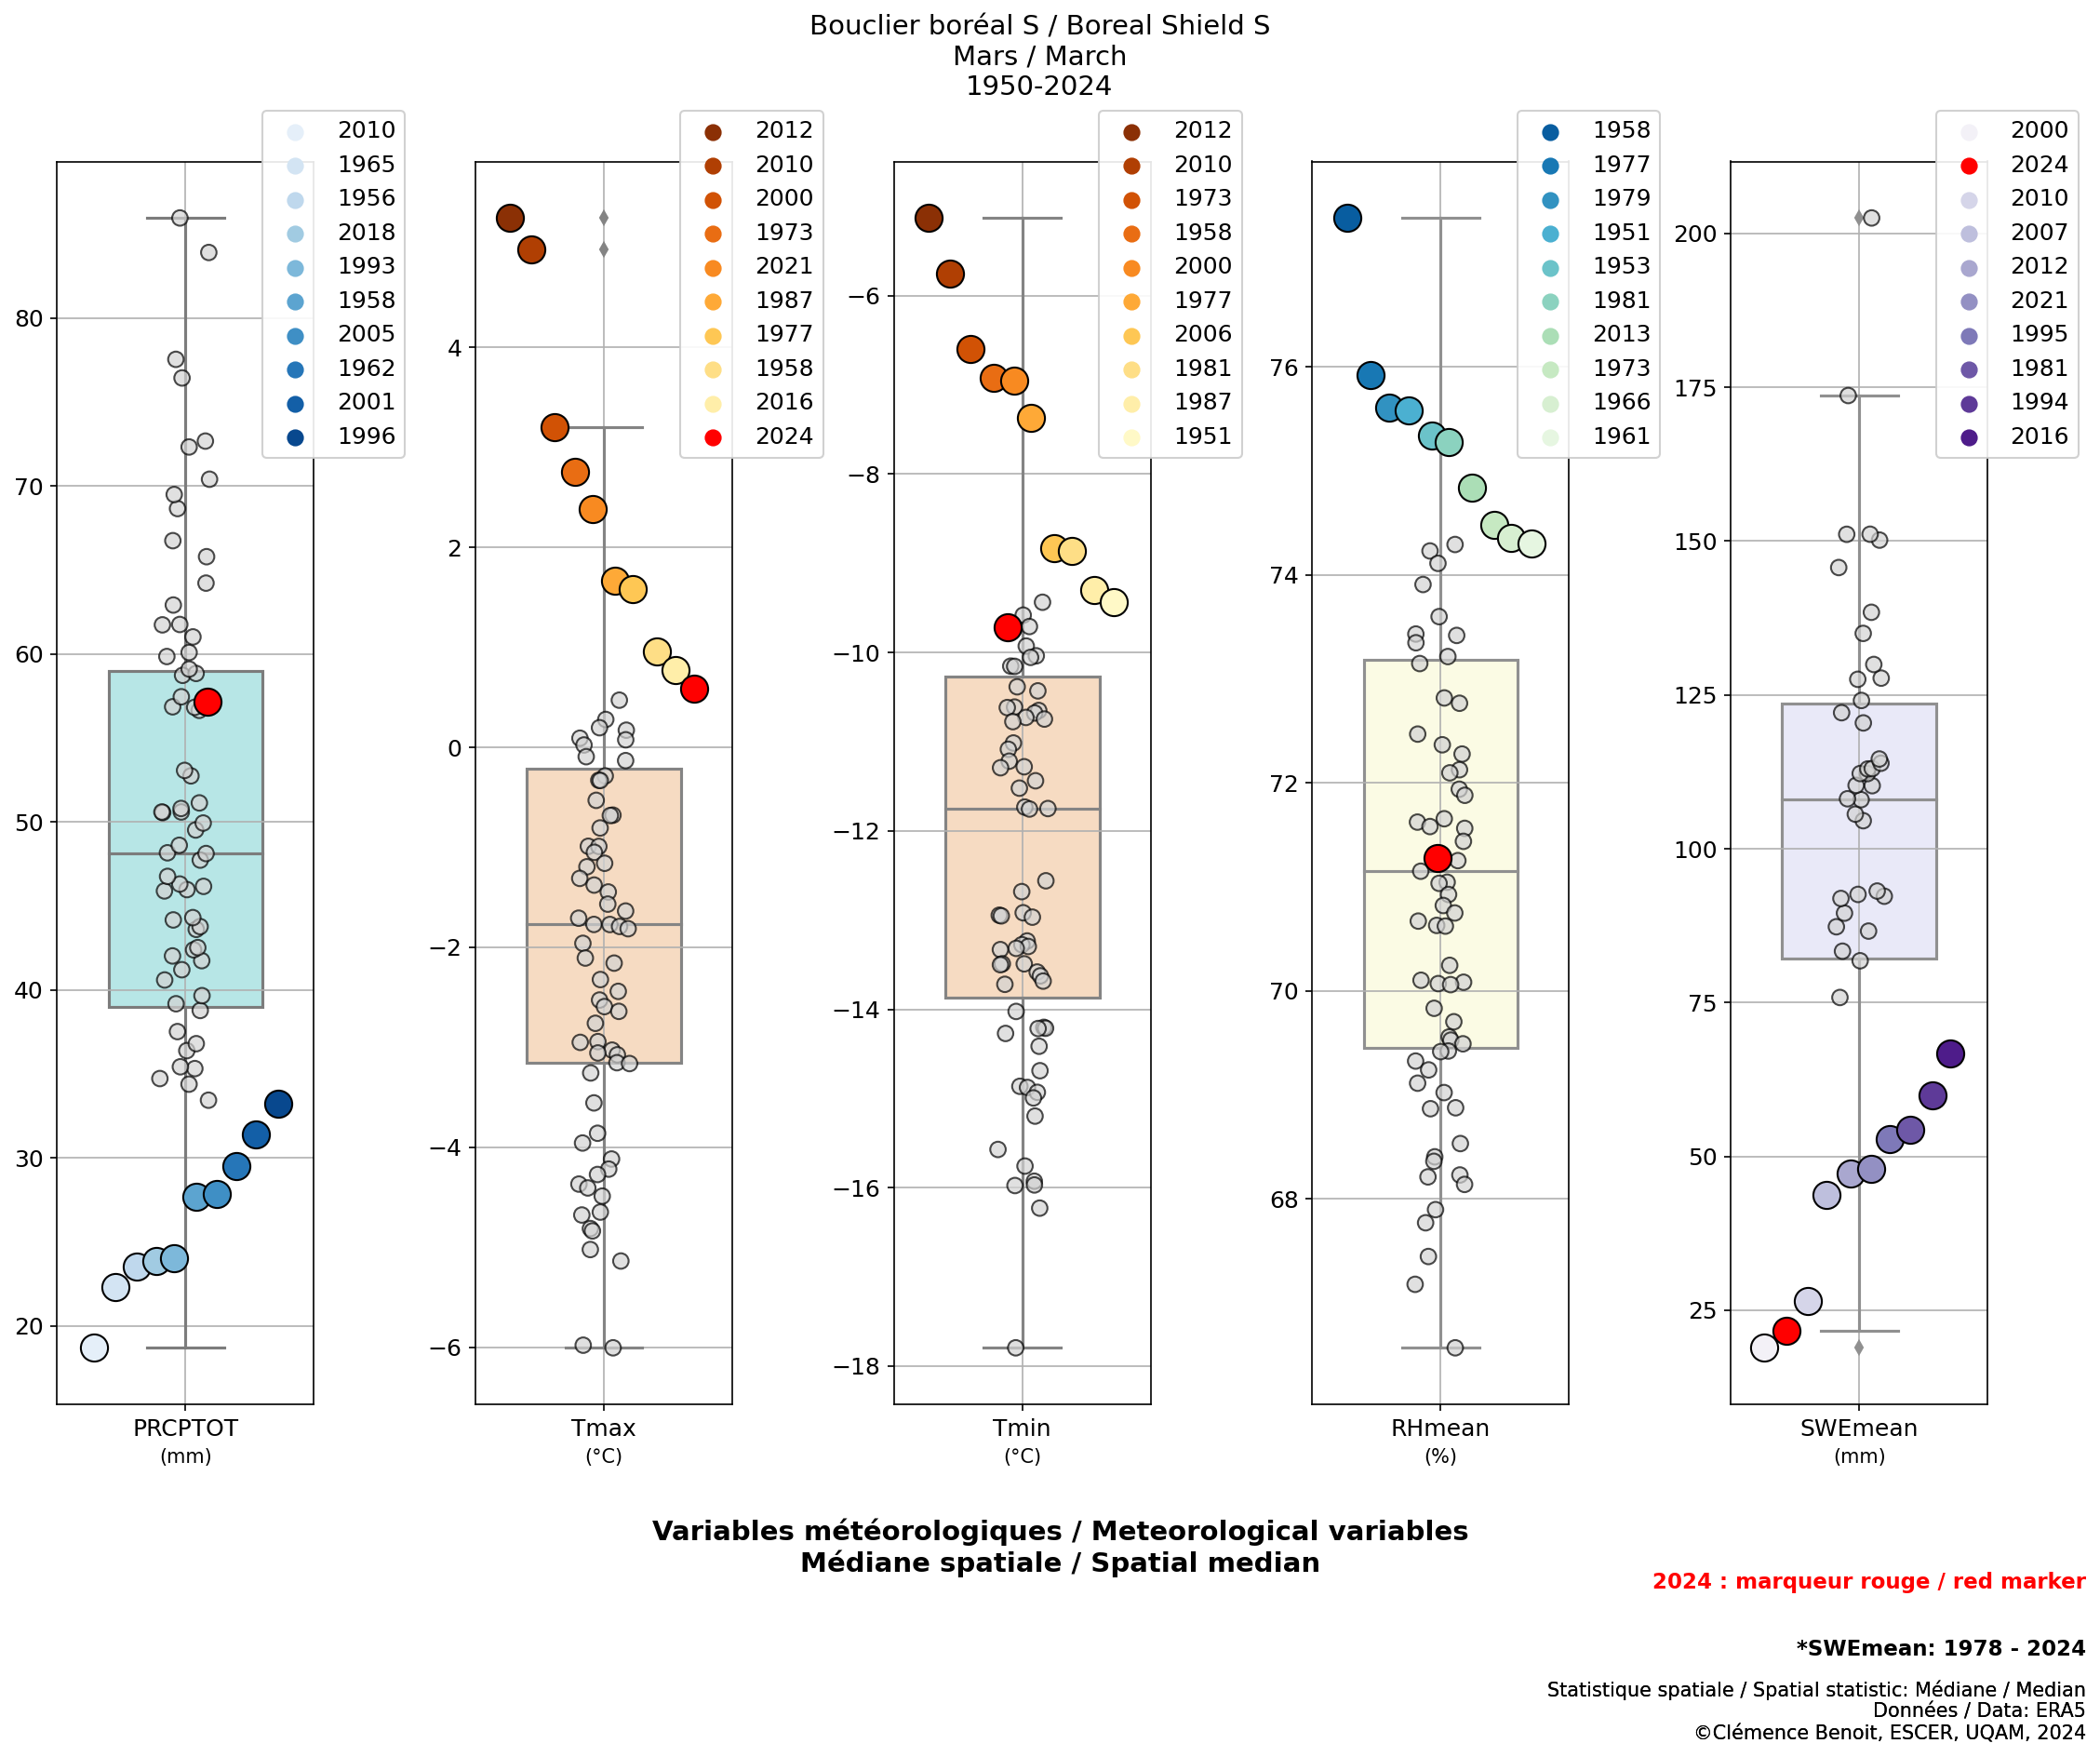
Boxplots
In this section, the statistical distributions of monthly, seasonal or annual meteorological fields or FWI indices, calculated for a given territory, are represented using box plots. This type of graphical representation allows to quickly show the extreme values for a month/season/year (values outside the boundaries of the box plots), the first and third quartiles (values given by the boundaries of the box plots) as well as the median of the distribution (black line inside the box plot). The time series for the analyses are from 1950 to the present, except for the SWEmean variable, where the period considered is from 1979 to the present, due to some outliers obtained from 1950 to 1978 (large positive anomalies with respect to the normal for most years).
The proposed figures show in particular the 10 years with the most exceptional values, in relation to the risk of forest fires (the lowest values, in the case of precipitation and snow, and the highest values in the case of FWI indices and temperature variables). In addition, the value of the last year compiled is displayed in red.
Using the interactive menu, please select in order, the type of variables (weather variables or FWI indices), the time scale on which the variables or indices are summarized (monthly, seasonal or annual), the month or season, where applicable, and the type and name of the area of interest.
Variables / Indices
Frequency
Month / Season
Area type
Area name